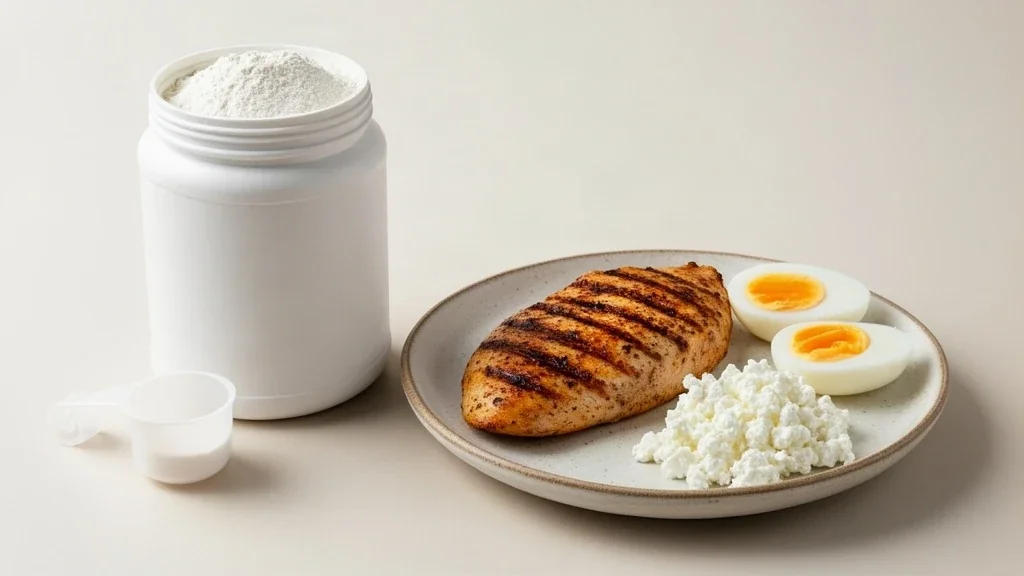
How to Avoid Protein Powder Scams: Spotting Amino Spiking and Fake Macros
You buy a tub of protein powder with a bold label claiming “25g Protein Per Scoop.” You log that scoop into your macro tracker, assume your daily protein goal is covered, and move on.
In reality, you might only be getting 14 grams of intact, muscle-building whey protein. The remaining 11 grams on the label could be cheap, non-essential amino acids dumped into the tub to artificially inflate laboratory tests.
This practice is called amino spiking (or nitrogen spiking). It is legal under current labeling loopholes, widely practiced by budget supplement brands, and one of the most common reasons lifters fail to hit their true amino acid targets.
Here is how amino spiking works, the 4-step label audit to catch it, and how to verify the macro math on any supplement tub before buying.
The Chemistry Behind the Scam: The Nitrogen Test Loophole
Commercial food and supplement testing does not count individual protein molecules. Instead, laboratories measure total nitrogen content using standard analytical procedures known as the Kjeldahl method or Dumas combustion assay.
Because intact dietary proteins contain an average of 16% nitrogen by weight, testing laboratories multiply the total nitrogen measured in a sample by a standard conversion factor of 6.25 (100 / 16 = 6.25) to calculate declared protein grams on the Nutrition Facts panel:
Declared Protein (grams) = Total Measured Nitrogen (grams) × 6.25The scam takes advantage of simple arithmetic: the nitrogen test cannot differentiate between complete dietary protein (like intact whey isolate or micellar casein) and cheap, free-form amino acids.
Manufacturers exploit this by purchasing bulk industrial amino acids that cost a fraction of real dairy protein:
| Compound Added | Nitrogen Content by Weight | Wholesale Cost per kg | Impact on Nitrogen Test |
|---|---|---|---|
| Pure Whey Protein Isolate | ~16% | $18.00 - $26.00 | True complete protein with ~11% leucine |
| Glycine | 18.7% | $3.50 - $5.00 | Registers as 117% “protein” on nitrogen tests |
| Taurine | 11.2% | $3.00 - $4.50 | Registers as 70% “protein” on nitrogen tests |
| L-Arginine | 32.2% | $7.00 - $10.00 | Registers as 201% “protein” on nitrogen tests |
| Creatine Monohydrate | 32.1% | $4.50 - $6.50 | Registers as 200% “protein” on nitrogen tests |
When a manufacturer adds 5 grams of glycine and 3 grams of creatine to a scoop, standard laboratory tests report 8 to 11 grams of extra “protein.” The brand legally prints “25g Protein” on the front label, saves 40% on manufacturing costs, and leaves you with an incomplete amino acid profile that fails to adequately stimulate muscle protein synthesis (MPS).
The 4-Step Label Audit
Protein Powder Quality & Blending Standards
- Verify third-party certification (Informed-Choice / NSF) to ensure absence of amino spiking.
- Target at least 20-25g intact protein per 30g scoop (over 70% protein by total powder weight).
- Blend micellar casein or cottage cheese for 30 seconds for ultra-smooth dessert and sauce textures.
Macro arithmetic verified against USDA FoodData Central and Atwater 4P+4C+9F standard.
Before purchasing any protein powder, run this 4-step audit directly on the ingredient label.
Step 1: Scan for Added Free-Form Amino Acids
Step 2: Calculate the "Scoop-to-Protein" Purity Ratio
Step 3: Run the 4/4/9 Calorie Integrity Check
Step 4: Verify Independent Third-Party Certification Seals
1. Scan the Ingredient List for Added Amino Acids
Look at the “Other Ingredients” or the protein blend breakdown. If you see any of the following ingredients listed anywhere on the container without an explicit, separate milligram breakdown outside the protein total, the powder is likely spiked:
- Glycine
- Taurine
- L-Arginine
- L-Glutamine
- Creatine Monohydrate (unless sold explicitly as an all-in-one recovery product with creatine declared separately)
- “Amino Acid Matrix” or “Recovery Blend”
A pure whey protein powder should have a simple ingredient list: Whey Protein (Isolate, Concentrate, or Hydrolysate), natural/artificial flavorings, lecithin (sunflower or soy for mixability), salt, and a sweetener (sucralose, stevia, or monk fruit).
2. The Scoop-to-Protein Purity Ratio Test
Check the serving size in grams at the top of the Nutrition Facts panel versus the total protein grams per serving:
Purity Percentage = (Protein Grams per Serving / Total Serving Size in Grams) × 100
- High-Quality Isolate: 85% to 92% protein by weight (e.g., 25g protein in a 28g to 30g scoop).
- Quality Concentrate (WPC-80): 75% to 82% protein by weight (e.g., 24g protein in a 30g to 32g scoop).
- Red Flag Product: 50% to 65% protein by weight (e.g., 20g protein in a 40g scoop with only 2g fat and 3g carbs declared).
If a 40-gram scoop yields 20g of protein, 2g of carbs, and 2g of fat, that totals 24g of active macronutrients. What makes up the remaining 16 grams? Flavoring and cocoa powder only account for 3 to 5 grams. The rest is unlisted maltodextrin, thickeners, or spiking fillers.
3. The 4P + 4C + 9F Calorie Verification
Every food label must obey fundamental thermodynamics. Protein and carbohydrates yield 4 calories per gram; dietary fat yields 9 calories per gram:
Calculated Calories = (Protein × 4) + (Carbs × 4) + (Fats × 9)
Compare the calculated total with the declared calories on the tub:
| Product Example | Declared Label | Formula Check | Verdict |
|---|---|---|---|
| Clean Whey Isolate | 120 kcal | 26P, 1C, 1F | (26 × 4) + (1 × 4) + (1 × 9) = 104 + 4 + 9 = 117 kcal | Pass (Within 3 kcal normal label rounding) |
| Suspect Budget Whey | 110 kcal | 25P, 4C, 2F | (25 × 4) + (4 × 4) + (2 × 9) = 100 + 16 + 18 = 134 kcal | Fail (24 kcal hidden deficit or spiked protein) |
If the declared calories are significantly lower than the mathematical sum of the macros, the manufacturer is underreporting carbs/fats or manipulating protein testing.
4. Check for Third-Party Testing Seals
Reputable manufacturers pay independent testing laboratories to verify label claims and test for banned substances and heavy metals. Look for certified seals:
- Informed-Sport / Informed-Choice: Verifies batch testing for label accuracy and athletic banned substances.
- NSF Certified for Sport: Gold-standard audit of facilities, raw materials, and finished product potency.
- USP (United States Pharmacopeia): Rigorous verification of dietary ingredient purity.
- Labdoor / Clean Label Project: Independent consumer testing benchmarks.
Whole Food Proteins vs. Protein Powder: Digestion and Satiety
While unspiked whey protein is a convenient tool to close macro gaps, it should never fully replace whole animal and plant protein sources.
DIGESTION KINETICS
| Whey Protein Powder | Whole Food Animal Proteins |
|---|---|
| • Rapid transit time | • Sustained gastric release |
| • Fast blood leucine peak | • Steady amino acid delivery |
| • Lower thermic effect | • ~50% higher thermic effect |
| • Low satiety response | • High fullness index |
Exercise nutrition research demonstrates clear physiological differences:
- Absorption Kinetics: Tang et al. (2009) showed that whey protein causes a rapid, transient surge in blood leucine concentration, whereas whole intact proteins (such as dairy casein, meat, and eggs) provide sustained hyperaminoacidemia over 4 to 6 hours.
- Thermic Effect of Food (TEF): A clinical trial by Barr & Wright (2010) in Food & Nutrition Research found that isoenergetic whole food meals expended nearly 50% more postprandial energy during digestion than highly processed liquid meals.
Use protein powder to support your daily targets when cooking is impractical, but build your primary foundation around whole meals.
Verified Meal Examples: Powder vs. Whole Food Macros
Here is how a clean protein smoothie compares with standard whole-food meals from verified nutritional databases:
Meal 1: Clean Protein Smoothie
- 1 scoop (30g) Unspiked Whey Isolate
- 1/2 cup Rolled Oats
- 1/2 cup Frozen Mixed Berries
- 1 cup Unsweetened Almond Milk
| Macro | Quantity |
|---|---|
| Protein | 35g |
| Carbs | 48g |
| Fats | 7g |
| Calories | 395 kcal |
Macronutrient math: (35 × 4) + (48 × 4) + (7 × 9) = 140 + 192 + 63 = 395 kcal.
Meal 2: Whole Food Lean Anchor (Chicken & Rice)
- 6 oz Cooked Chicken Breast
- 1 cup Cooked Jasmine Rice
- 1.5 cups Steamed Broccoli florets
| Macro | Quantity |
|---|---|
| Protein | 54g |
| Carbs | 45g |
| Fats | 8g |
| Calories | 468 kcal |
Macronutrient math: (54 × 4) + (45 × 4) + (8 × 9) = 216 + 180 + 72 = 468 kcal.
Meal 3: Greek Yogurt Power Bowl
- 1 cup (227g) Nonfat Plain Greek Yogurt
- 1/2 cup Fresh Berries
- 1/4 cup Low-Sugar Granola
| Macro | Quantity |
|---|---|
| Protein | 20g |
| Carbs | 45g |
| Fats | 8g |
| Calories | 332 kcal |
Macronutrient math: (20 × 4) + (45 × 4) + (8 × 9) = 80 + 180 + 72 = 332 kcal.
Macronutrient Comparison Summary
| Meal | Protein | Carbs | Fats | Calories | Satiety Level | Prep Time |
|---|---|---|---|---|---|---|
| Clean Whey Smoothie | 35g | 48g | 7g | 395 | Moderate (2-3 hrs) | 2 mins |
| Chicken Breast & Rice | 54g | 45g | 8g | 468 | High (4-5 hrs) | Batch Prepped |
| Greek Yogurt Bowl | 20g | 45g | 8g | 332 | High (3-4 hrs) | 1 min |
If you are trying to hit high daily targets (like 160g to 200g daily) without over-relying on supplements, check out our guide on macro tracking mistakes to avoid and our breakdown of how to hit 200g protein daily with whole food.
Summary: The Buyer’s Protection Checklist
Before purchasing your next tub of protein powder:
- Check the ingredient list: Ensure no free-form glycine, taurine, or glutamine are included in the protein count.
- Check the ratio: Confirm protein represents at least 75% of total scoop weight for concentrates and 85%+ for isolates.
- Verify the math: Multiply
(Protein × 4) + (Carbs × 4) + (Fats × 9)and ensure it matches the stated calories. - Demand third-party testing: Look for the Informed-Choice, Informed-Sport, or NSF Sport mark.
Plan Your Daily Macros With Real Food
Want to see how your favorite meals and clean protein sources fit into your exact daily targets? Use our free Macro Meal Planner. Input your target calories, protein, carbohydrates, and fats to reverse-engineer balanced daily meal combinations instantly.
Evidence and Sources
- Barr S. B., & Wright J. C. (2010). Postprandial energy expenditure in whole-food and processed-food meals: implications for daily energy expenditure. Food & Nutrition Research, 54(1), 5144.
- Jäger R., et al. (2017). International Society of Sports Nutrition Position Stand: protein and exercise. Journal of the International Society of Sports Nutrition, 14(1), 20.
- Morton R. W., et al. (2018). A systematic review, meta-analysis and meta-regression of the effect of protein supplementation on resistance training-induced gains in muscle mass and strength in healthy adults. British Journal of Sports Medicine, 52(6), 376–384.
- Tang J. E., et al. (2009). Ingestion of whey hydrolysate, casein, or soy protein isolate: effects on mixed muscle protein synthesis at rest and following resistance exercise in young men. Journal of Applied Physiology, 107(3), 987–992.
- USDA FoodData Central. Nutrient profiles for Chicken Breast (FDC 171077), Greek Yogurt (FDC 170903), and Oats (FDC 170688). fdc.nal.usda.gov.
Tools That Make This Easier
A few tools remove the guesswork from the math above:
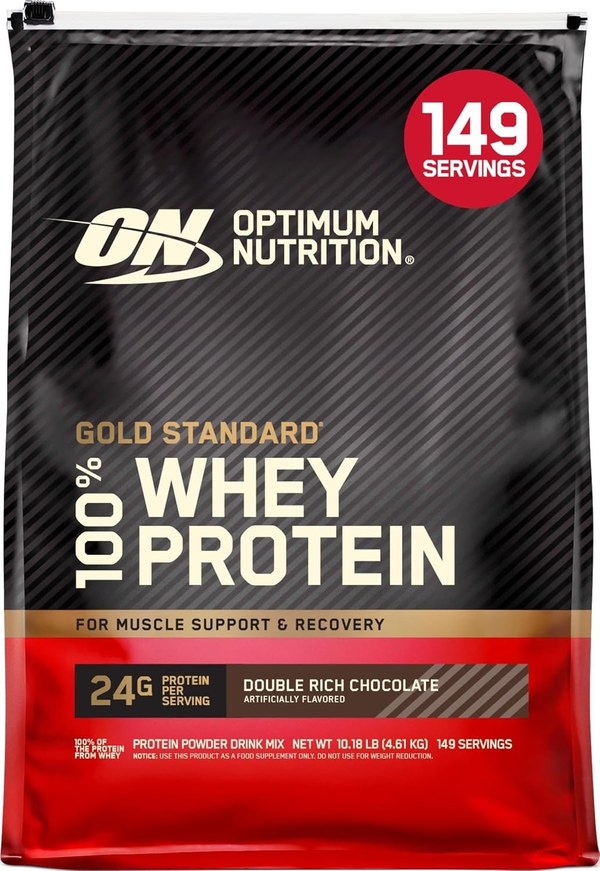 Optimum Nutrition Gold Standard 100% Whey (5 lb) — a third-party-tested whey with a clean label, the benchmark for spotting amino spiking.
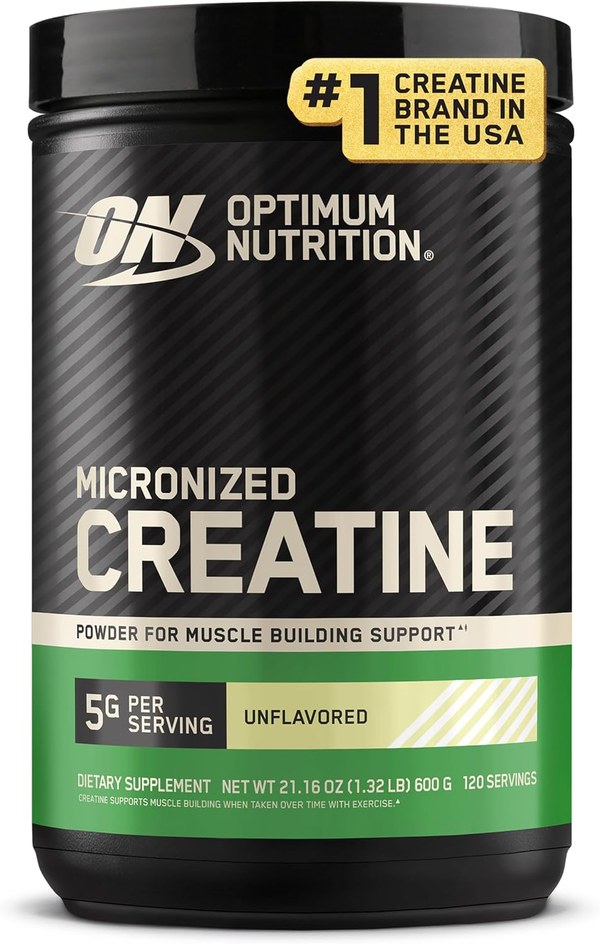 Optimum Nutrition Micronized Creatine Monohydrate — another plain, single-ingredient supplement that is easy to verify.
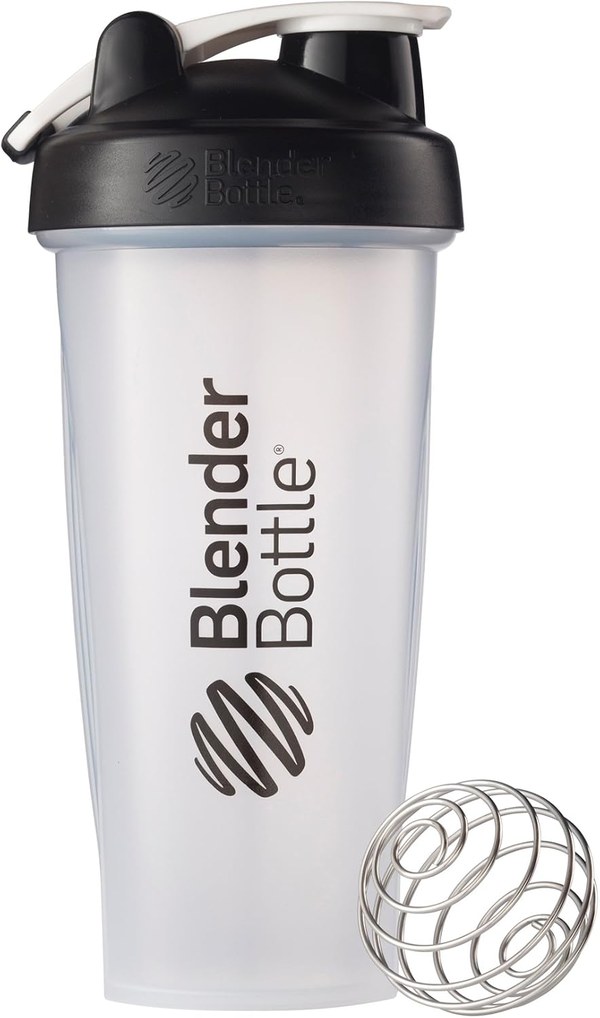 BlenderBottle Classic 28oz Shaker — a measured bottle that removes the guesswork from serving size.
Disclosure: as an Amazon Associate we earn from qualifying purchases. Prices are current as of writing and may change.